knowledge is power

0%

How to dump out a backtrace at runtime

Featured image

1. Overview

PostgreSQL is a great open source database developed and maintained by many great software engineers around the world. In each release, there are many features added to this open source database. For example, one feature is very helpful for developer is backtrace_functions introduced in PostgreSQL 13 , which allows a developer to dump out the backtrace when certain errors happened on the server. In this blog, I am going to explain it in a little bit more detail.

2. What is backtrace_functions?

The backtrace_functions option is an option introduced for developers as it is described here. You can specify a list of c function names separated by comma, if an error is raised and matches any c function in the given list, then the backtrace will be logged into the logfile. This is very useful for debugging some specific areas of the source code, especially when the error happens randomly. As the document also mentioned, this option is not available on all platforms, and quality of the backtraces depends on the compilation options. For this reason, all the examples used in this blog were tested on Ubuntu 18.04 with gcc version 7.5.0.

3. How to make it work?

This feature was first committed in Nov, 2019 as showing below.

1
2
3
4
5
commit 71a8a4f6e36547bb060dbcc961ea9b57420f7190
Author: Alvaro Herrera <alvherre@alvh.no-ip.org>
Date: Fri Nov 8 15:44:20 2019 -0300

Add backtrace support for error reporting

To use this feature, you need to add the key word backtrace_functions to postgresql.conf file with the c function names. It can be either a single c function name or a list of c function names separated by comma. In this blog, we use circle_in as an example. Here is what I added to my postgresql.conf file.

1
2
$ tail -n1 $PGDATA/postgresql.conf
backtrace_functions='circle_in'

After restart the server, use psql connect to the server and enter below SQL queries (The postgresql source code used in this example is based on PostgreSQL13 development branch in March 2020, you can create your own error if you want to test this feature).

1
2
3
4
postgres=# create temp table src (f1 text);
postgres=# INSERT INTO tbl_circle(a) VALUES('( 1 , 1 ) , 5'::circle );
ERROR: invalid input syntax for type circle: "( 1 , 1 ) , 5"
LINE 1: INSERT INTO tbl_circle(a) VALUES('( 1 , 1 ) , 5'::circle );

An error is raised, now, if you dump the logfile, $ cat logfile you should see something like below,

1
2
3
4
5
6
7
8
9
10
11
12
13
14
15
16
17
18
19
20
21
2020-12-14 13:43:22.541 PST [25220] ERROR:  invalid input syntax for type circle: "( 1 , 1 ) , 5" at character 34
2020-12-14 13:43:22.541 PST [25220] BACKTRACE:
postgres: david postgres [local] INSERT(circle_in+0x1ca) [0x55bc1cdfaa8a]
postgres: david postgres [local] INSERT(InputFunctionCall+0x7b) [0x55bc1cec375b]
postgres: david postgres [local] INSERT(OidInputFunctionCall+0x48) [0x55bc1cec39c8]
postgres: david postgres [local] INSERT(coerce_type+0x19a) [0x55bc1cb9d72a]
postgres: david postgres [local] INSERT(coerce_to_target_type+0x9d) [0x55bc1cb9e0ed]
postgres: david postgres [local] INSERT(+0x1c748f) [0x55bc1cba248f]
postgres: david postgres [local] INSERT(transformExpr+0x14) [0x55bc1cba59f4]
postgres: david postgres [local] INSERT(transformExpressionList+0x9f) [0x55bc1cbb273f]
postgres: david postgres [local] INSERT(transformStmt+0x1a47) [0x55bc1cb782d7]
postgres: david postgres [local] INSERT(parse_analyze+0x4f) [0x55bc1cb7957f]
postgres: david postgres [local] INSERT(pg_analyze_and_rewrite+0x12) [0x55bc1cd9fd62]
postgres: david postgres [local] INSERT(+0x3c531f) [0x55bc1cda031f]
postgres: david postgres [local] INSERT(PostgresMain+0x1f04) [0x55bc1cda25b4]
postgres: david postgres [local] INSERT(+0x34c168) [0x55bc1cd27168]
postgres: david postgres [local] INSERT(PostmasterMain+0xeff) [0x55bc1cd2827f]
postgres: david postgres [local] INSERT(main+0x4a4) [0x55bc1ca9b4e4]
/lib/x86_64-linux-gnu/libc.so.6(__libc_start_main+0xe7) [0x7f6c22eeab97]
postgres: david postgres [local] INSERT(_start+0x2a) [0x55bc1ca9b5aa]
2020-12-14 13:43:22.541 PST [25220] STATEMENT: INSERT INTO tbl_circle(a) VALUES('( 1 , 1 ) , 5'::circle );

As we can see the error is happening in circle_in function, which is called by function InputFunctionCall, so on and so forth. This is exactly like the backtrace when you are debugging the source code using gdb, but you may also find that some function names are showing up as a hex string, such as 0x3c531f. The reason some function names are not showing up is because they are static functions. For these functions, we need to use the addr2line to convert the addresses into file names and line numbers. For example,

1
addr2line 0x3c531f -f -e `which postgres`

, where -f displays the function names as well as file and line number, -e used to specify the name of the executable for which addresses should be translated.

It depends on the compilation parameters, if you compile the postgre with default CFLAG, you may get something like below,

1
2
3
$ addr2line 0x3c531f -f -e `which postgres`
exec_simple_query
postgres.c:?

Where the line number doesn’t show up. To get the line number and file name, let’s add the option -ggdb to CFLAGS and then recompile the source code.

1
./configure '--prefix=/home/david/pgapp' 'CFLAGS=-ggdb'

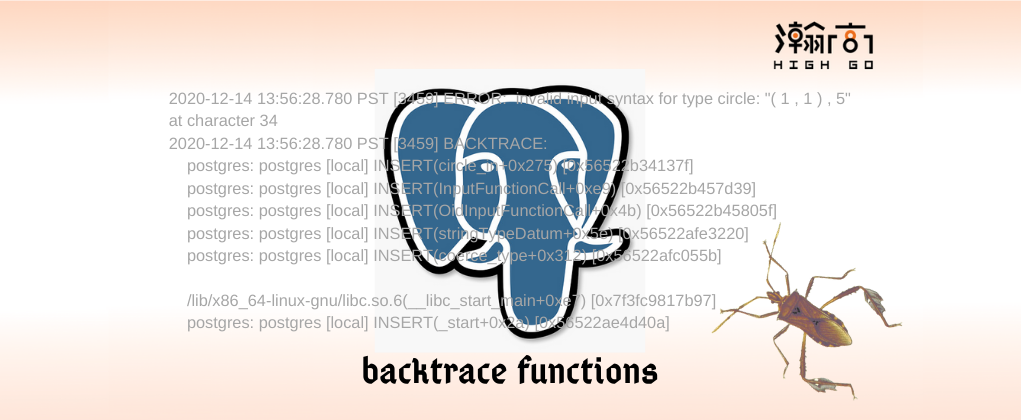
Now, if you repeat the above test, then you should get a similar backtrace like below,

1
2
3
4
5
6
7
8
9
10
11
12
13
14
15
16
17
18
19
20
21
22
23
24
25
26
27
28
2020-12-14 13:56:28.780 PST [3459] ERROR:  invalid input syntax for type circle: "( 1 , 1 ) , 5" at character 34
2020-12-14 13:56:28.780 PST [3459] BACKTRACE:
postgres: david postgres [local] INSERT(circle_in+0x275) [0x56522b34137f]
postgres: david postgres [local] INSERT(InputFunctionCall+0xe9) [0x56522b457d39]
postgres: david postgres [local] INSERT(OidInputFunctionCall+0x4b) [0x56522b45805f]
postgres: david postgres [local] INSERT(stringTypeDatum+0x5e) [0x56522afe3220]
postgres: david postgres [local] INSERT(coerce_type+0x312) [0x56522afc055b]
postgres: david postgres [local] INSERT(coerce_to_target_type+0x95) [0x56522afc017b]
postgres: david postgres [local] INSERT(+0x237e37) [0x56522afcde37]
postgres: david postgres [local] INSERT(+0x232606) [0x56522afc8606]
postgres: david postgres [local] INSERT(transformExpr+0x3a) [0x56522afc83a2]
postgres: david postgres [local] INSERT(transformExpressionList+0x133) [0x56522afdee38]
postgres: david postgres [local] INSERT(+0x1ecf87) [0x56522af82f87]
postgres: david postgres [local] INSERT(transformStmt+0x96) [0x56522af821ac]
postgres: david postgres [local] INSERT(+0x1ec114) [0x56522af82114]
postgres: david postgres [local] INSERT(transformTopLevelStmt+0x27) [0x56522af8200f]
postgres: david postgres [local] INSERT(parse_analyze+0x73) [0x56522af81e85]
postgres: david postgres [local] INSERT(pg_analyze_and_rewrite+0x49) [0x56522b2c1bcb]
postgres: david postgres [local] INSERT(+0x52c2b5) [0x56522b2c22b5]
postgres: david postgres [local] INSERT(PostgresMain+0x813) [0x56522b2c6895]
postgres: david postgres [local] INSERT(+0x4889d7) [0x56522b21e9d7]
postgres: david postgres [local] INSERT(+0x488111) [0x56522b21e111]
postgres: david postgres [local] INSERT(+0x48469f) [0x56522b21a69f]
postgres: david postgres [local] INSERT(PostmasterMain+0x1283) [0x56522b219e5a]
postgres: david postgres [local] INSERT(+0x395c54) [0x56522b12bc54]
/lib/x86_64-linux-gnu/libc.so.6(__libc_start_main+0xe7) [0x7f3fc9817b97]
postgres: david postgres [local] INSERT(_start+0x2a) [0x56522ae4d40a]
2020-12-14 13:56:28.780 PST [3459] STATEMENT: INSERT INTO tbl_circle(a) VALUES('( 1 , 1 ) , 5'::circle );

Let’s run the command addr2line with the new hex address string again,

1
2
3
$ addr2line 0x52c2b5 -f -e `which postgres`
exec_simple_query
/home/david/postgres/src/backend/tcop/postgres.c:1155

Now, we get the function name, file name and the line number.

4. Summary

This blog simply discussed one very useful option introduced to PostgreSQL 13 for developers. I use this option a lot during my daily development work, and it helps me quickly locate the errors. I also use this feature when someone reports an error which happens randomly. To debug such issue, I simply enable it with the c function names. When the error happens again, then I can get the exactly backtrace. The backtrace_functions does make my work much easier when tracing a bug.

Reference:

1. Database World